Viewing Connection Details
This tutorial describes how to view detailed information about connections between variables in your model using the view_connections function. The intent of view_connections is to help spot things like bad or missing unit conversions, connections to inputs that are either unintended or missing, or input variables that are the wrong size. In many cases, the view_tree function, described in Visualizing OpenMDAO Model Structure and Connections may provide a faster way to spot missing or unintended connections.
The view_connections function may be called on a Problem or a Group, and it will only work when called after Problem setup. For example:
from openmdao.api import Problem, Group, view_connections

prob = Problem(root=Group())

# define my model...

prob.setup()

# we'll set show_browser=False here to prevent a webbrowser from
# popping up during our doc testing.
view_connections(prob.root, show_browser=False)
The options you can pass to view_connections are:
- outfile: The name of the html output file. This defaults to connections.html.
- show_browser: If True, pop up a webbrowser to view the file. Defaults to True.
The html file generated by view_connections is self-contained, so it can be passed around to other people, but it does require network access in order to load the d3 library.
The following shows what the viewer looks like for a pycycle turbofan model:
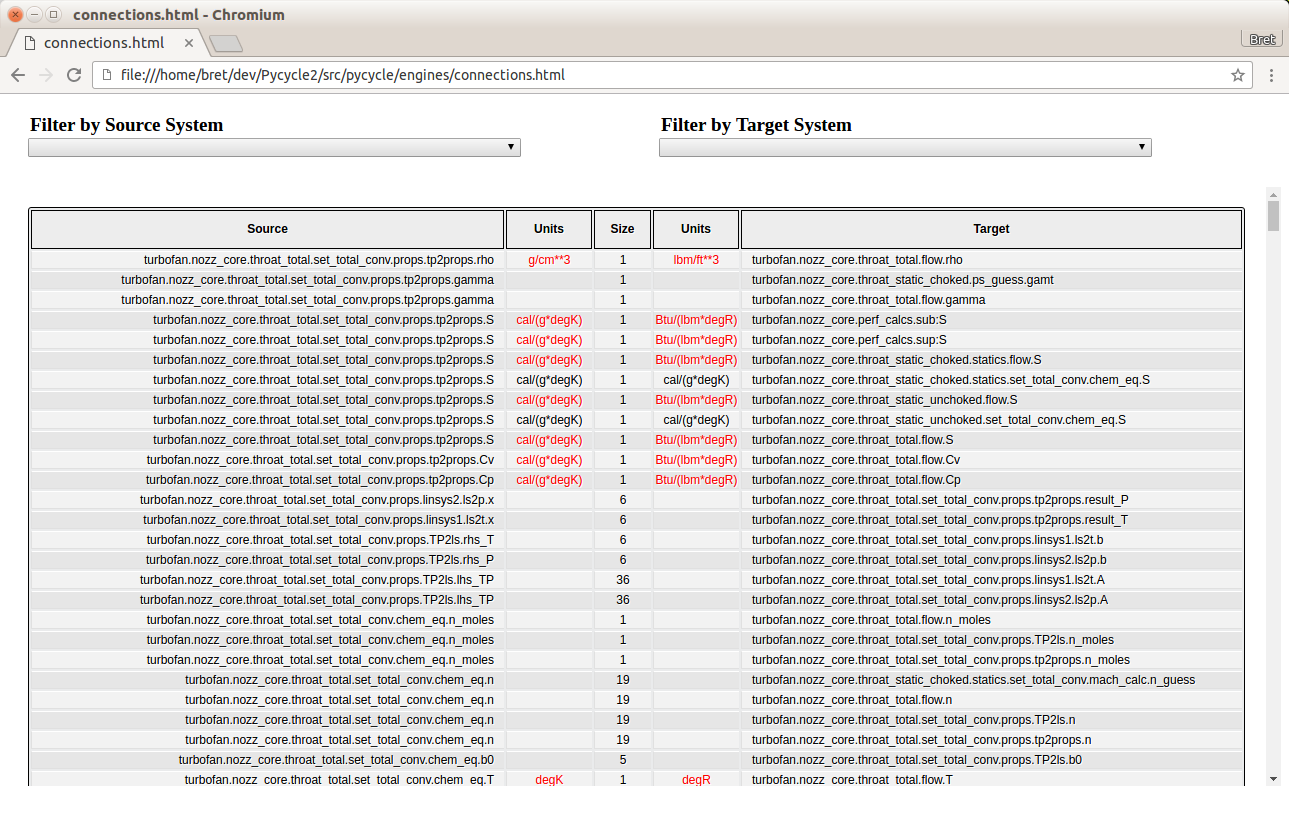
Source variables are shown in the left column, followed by a column containing their units. The center column contains the size of the target variable, followed by the units and finally the name of the target variable. Units are highlighted in red when the unit string on the source differs from the one on the target.
Note the scrollbar on the right, which is necessary due to the large number of connections found in the turbojet model. Using the Filter by Source System and Filter by Target System fields at the top of the page, we can zero in on parts of the model and ignore the rest. For example, if we were interested only in what’s connected to the inputs of the turbofan.lp_spool.core.shaftH component, we could put that in the Filter by Target System field. We would then see the following:
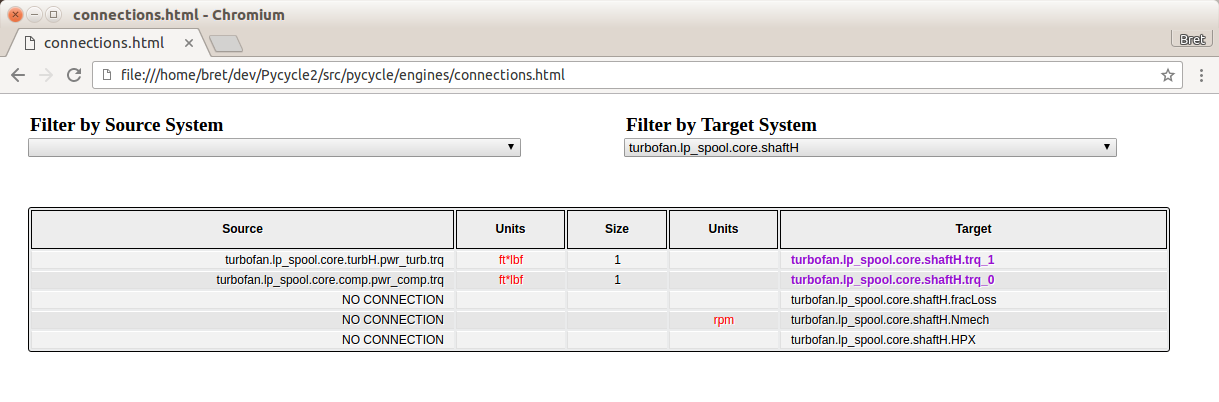
There are two things to mention here. First, note that some of the target names are highlighted. Those are inputs that are connected to source variables found outside of the target system. In this particular case, where our target is a Component, not a Group, any inputs that are connected will be highlighted, because their sources will always be outside of that Component. If our target system were a Group, then some of the connections would be internal to that Group, and some would cross the Group boundary. Those crossing the Group boundary would be highlighted. The second thing to mention is that even unconnected variables are shown in the viewer, but their source or target will be displayed as NO CONNECTION. This can be useful when you want to show all dangling input variables on a specific Group or Component, for example:
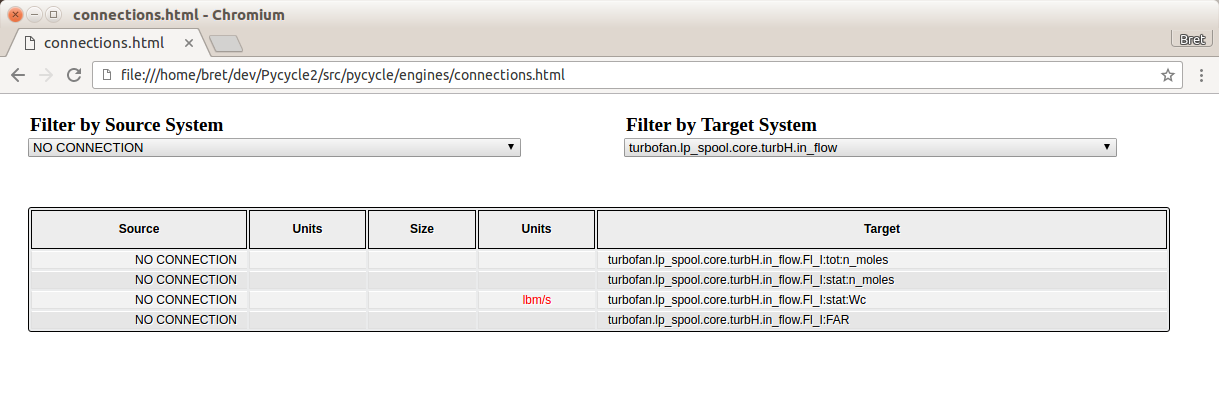
Here we show all unconnected inputs found on the turbofan.lp_spool.core.turbH.in_flow Component by specifying the Component name in the Filter by Target System field and NO CONNECTION in the Filter by Source System field.